The Mischievous Case-Insensitive Hash
 In a comment to the previous article on a case insensitive hash code, Stefan Glienke pointed to an approach used in Spring4D’s comparers, which is a delightful hack.
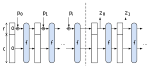
Rather than converting the string to a “proper lower case”, it converts the string to an “approximate lower case” using an “or $20”, which happens to be good enough for a hash on string identifiers.
To figure the trick, one needs to check the ASCII Table. (more…)
 Recent commits to the
  Here I will share my current workflow for low-level optimization, which these days is basically a roundtrip between Delphi,
  Just created a new repository with a “LibCBLAS” unit meant to use the OpenBLAS library in its Windows 64bit incarnation from Delphi 10.3+
 A new kernel for
  A trivial way to turn a case-sensitive String hash function into a case-insensitive one is to to pass a lower-case (or upper-case) version of the String.
 Following a recent post by A. Bouchez about
  In a Google+ comment to my recent article about