SamplingProfiler v1.7.0 is now available, you can get the zip and release details from its changelog page.
As announced last week, the changes are a fix for a bug that could drastically affect the execution speed of the profiled application when relying on MAP files for debug information, if you were hit by this bug, things should be like night and day with this version (and hopefully I didn’t break anything else in the process…).
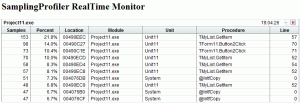
The other main addition is that of the real-time monitor, which with default parameters and when activated locally should be reachable at http://localhost:880/ (see the help for other details). The monitor is still at an early stage, and only provides real-time information, as time allows, it may grow to offer more profiling and debug features. The current monitor page is a rather basic html page that is fully refreshed periodically, which isn’t very pretty at the moment… an XML version of the real-time information is available at http://localhost:880/sampling.xml, if you come up with a pretty AJAX-based version before I do, feel free to contribute it 😉

COOL! Thanx a lot…
Nice. But can look at FreePascal map files? It will be much nicer if your profiler could support them. And btw, if nothing difficult is used in your code it is possible to port your profiler for linux/osx.
If you need some assistance feel free to contact me.
A while back I tried getting a map file out of FreePascal with no success, IIRC I even asked on the FreePascal (or Lazarus?) forums.
I also had a look at DWARF debug info, but the spec was several hundred pages, so I gave up without trying.
Do you have code available that would parse FreePascal debug info, and provide some minimal functionality, like enumerating the segments, and returning module/unit/procedure/line info from an execution address?
On Linux/OSX, I would guess there are already many profilers that support GDB/DWARF, SamplingProfiler was started to fill a niche (lack of sampling profilers for native Delphi in Windows).
To get map file from FreePascal one need to compile source using -Xm. I never had problems with that.
To get line info you can use next 2 files:
fpc\rtl\inc\lineinfo.pp
fpc\rtl\inc\lnfodwrf.pp
Default debugger format is stubs but it is also possible to compile with dwarf. First file I suppose reads from stabs and the second from dwarf.
Feel free to ask on fpc-pascal/fpc-devel mail list. There fpc devels will answer better about this.
Paul, I created a thread on FreePascal support and copied the comments there!
Should be more convenient to keep track of things.