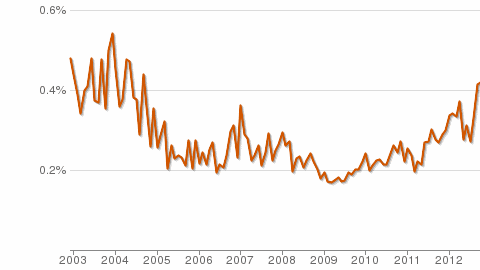
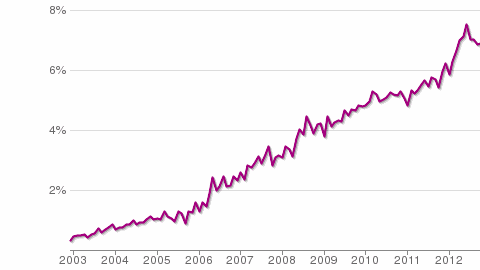
At least according to ohloh, when measuring commits to open-source projects, the graph is below:
Food for thought for Marco Cantù, the new Delphi Product Manager? The percentage figures are back in the 2004 range, and the trend after going downhill for years, reversed to shows 3+ years of growth.
When looking in details though, a most of the recent years activity is on projects around FreePascal and Lazarus projects, whereas at the turn of the millennium, the vast majority of it was targeted at Delphi.
The above chart is expressed in terms of percentage of activity in all open-source projects, 0.4% is low, but that better than Visual Basic does 😉 though there arguably never was a strong Visual Basic open-source community to begin with.
Other fashionable languages (C#, Java, PHP,Ruby, etc.) are quite higher, though their trends are flat or downward. Even Objective-C, is quite flat, indicating Apple developers probably don’t share.
There is however one language, that shows a constant, tranquil upward trends, it’s… JavaScript
I couldn’t find other languages with a similar trend, except maybe Python.


I think one of the reasons is new language features that made it possible to do things that were nearly impossible for the average Delphi developer (enhanced RTTI f.i.).
It doesn’t surprise me that “Apple developers probably don’t share.” Apple doesn’t allow them to.
Where are you drawing your information for the observations and comparisons with Objective-C ?
If you look at the curves for each language in isolation you get a distorted view. If you want to compare, then you should actually compare, and get the “curves” plotted on the same charts so that you see them relative to each other. When plotting individual charts the axes are scaled to fit the data, so comparing separate charts is difficult.
If you use the ohloh comparison tools, Objective-C not only has a much higher level of activity than Pascal but the Pascal activity trend is much, much flatter than the Objective-C trend, which – unsurprisingly – really took off in 2008. It may have been more level in the past 2 years, but then not much more so than Pascal.
Objective-C has typically and fairly consistently double the representation %ages of Pascal when comparing # of Contributors, # of Projects and # of Commits. The only stat where the two are comparable and indeed Pascal used to have (used to have) a higher representation, is in the # LOC committed.
In terms of absolute numbers, there are 3x as many Objective-C projects and 3x as many contributors.
Given that Objective-C is pretty much the exclusive preserve of Apple developers, and that Pascal has a far broader and wider reach than just Windows and Delphi, this disparity is all the more surprising and really puts Delphi’s place in the world into context.
I would post the graphs I grabbed from ohloh that show this if I could, but they are easily found by using the Language comparison facilities on ohloh itself.
Which community is it that doesn’t like to share again … ?
I just realised that the ohloh charts are conveniently encoded in the URL’s, so here you go…
Monthly Commits: http://goo.gl/3LHG4
Pretty much tracking each other, but Objective-C with double the representation
Monthly Contributors: http://goo.gl/vb3DD
Pascal still in decline, Objective-C running away!
Monthly LOC changed: http://goo.gl/GG3Mr
Objective-C plodding away, Pascal SERIOUSLY down on past activity
Monthly Projects: http://goo.gl/cNB08
Both showing resurgence, but Objective-C far more so than Pascal
Oh, oh. Somebody hasn’t read Edward Tufte’s, “The Visual Display of Quantitative Information”.
http://www.edwardtufte.com/tufte/books_vdqi
The links in the post go to the ohloh charts, you can then compare across languages.
The relative trends are what was discussed here, more than absolute values.
There is another thing to keep in mind though for absolute values (rather than percentages) it’s that historically, people committed more stuff less often, because the internet wasn’t as present nor as fast.
The percentages are relative to all ohloh activity across all tools, so looking at the percentages eliminates some of the bias (if you dig, you’ll see a steep ramp up in global commits around the years ADSL became widely deployed, followed by a plateau)
Doubtless, but the commits don’t show such a trend…
…while those do. That can be interpreted as lot of new projects started, but most got aborted/abandoned/stalled.
Otherwise, the commits trend would be similar to contributors/projects.
Another bias for the projects/contributors charts is introduced by git, where to forks are encouraged, and each fork (even if nothing is changed) counts as a new project and author.
Delphi is still heavily in svn, so there isn’t that magic multiplication of projects/authors happening.
All in all, beware of projects/authors.
LOCs are also slightly less significant than commits because of code formatting & refactoring tools, as a single class rename f.i. can result in hundreds of LOCs, so you can see huge bumps in the LOCs graph of a project that are actually just minor housekeeping changes.
Commits are a better indicator of activity IME
Ah I see – you are inferring information not present in the data to explain characteristics in the data ? I see. 😉
Surely the most significant metric in terms of determining “willingness to share” is the # Monthly Contributors, which as a trend has Objective-C in a period of strong and sustained growth and Pascal in continued decline, and in terms of %age of total data also has Objective-C streaks ahead of Pascal.
# Commits could also be an indicator of instability, so if you want to invent data to explain the data you could speculate that Pascal projects are inherently more buggy or that the contributors less competent and requiring more attempts to get things right.
Bottom line, if you don’t think the data is adequate to support particular conclusions then don’t draw such conclusions. Just say what the data says and leave it at that. No ?
Not by a long shot. If you ever participated in open-source, you’ll know the amount of contributors correlates to the number of users, as most contributors contribute small fixes or snippets in a one-off fashion (feel free to discuss that with the FreePascal guys, or other major Open-Source projects, don’t take my words).
Objective-C has all the hallmarks of a growing user base, but a very small open-source community (in terms of ratios, not in absolute figures).
And I’m not inferring data that isn’t there, I’m just interpreting the data that is there. Your interpretation doesn’t match that data, as it only applies in the cases you cited. Just look at the trends and absolute figures of other widespread languages (like C and Java), you’ll see that charts can’t be taken in isolation or two-by-two, as there are base effects to take into account that can’t be ignored.
It is getting a bit annoying to have this guy Jolyon trying to piss on every positive post or to promote the negative ones, specially if EMB is involved.
He seems to be really hurt for something, I’ll like to know what’s the history behind, because his bad blood is everywhere and it is definitely disturbing.